Leon Barrett's Computer Vison Final Project
Time Lapse
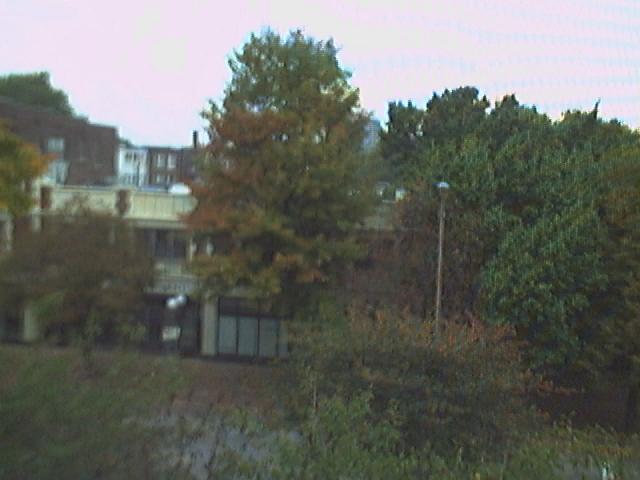
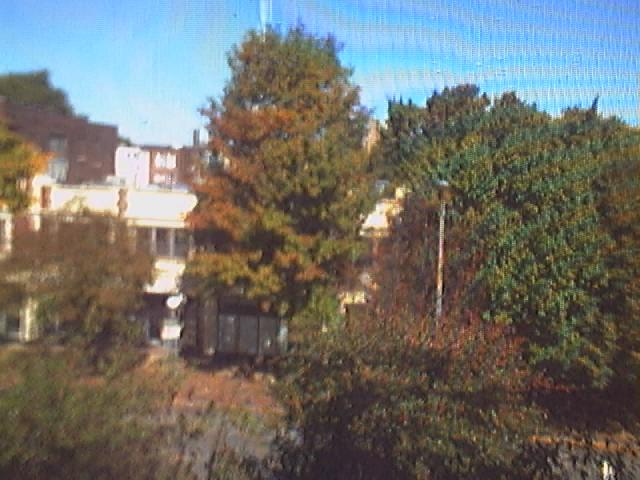
I took a bunch of pictures (one every two minutes for two months) out of my window during the fall of 2003.
The pictures mostly looked like this (taken from two different days at the same time of day):
I wanted to make a time-lapse video of the seasons changing, and here it is:
The original video(3.3 MB)
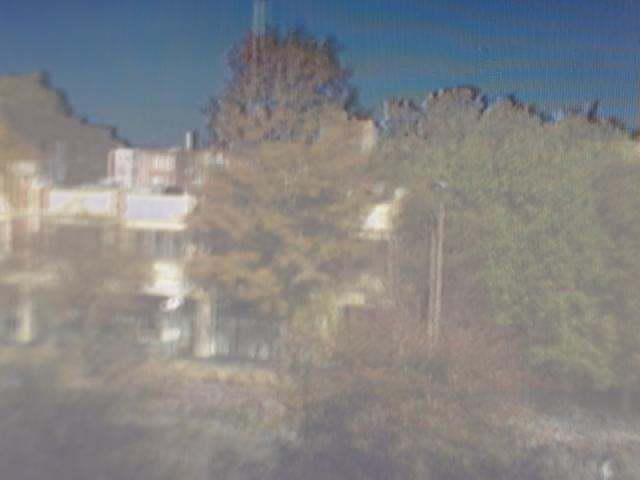
However, some days were pretty dark (as you can see), which made the video flickery.
So I wanted to be able to reconstruct sunnier days from darker days, as well as just get pretty pictures of the fall changing.
Principal Component Analysis
I approached analyzing the images by using principal component analysis to get a set of "eigenvectors" which described how the images vary between each other.
There were many images at high resolution, so the standard method (first, take a covariance matrix...) wasn't going to work (because the covariance matrix would occupy dozens of gigabytes).
Fortunately, Dr. Pless pointed out this paper, which addresses a covariance-less method for calculating the principal eigenvectors of a set of images (or other vectors).
The algorithm works acceptably and produces eigenvectors such as these (when run on the 55 daily pictures at noon).
See the eigenvectors here.
Each picture the webcam took is principally made up of the average image plus weighted sums of the eigenvectors (hence the name, "principal component analysis"), though there is a little left over.
One can extract how much of an eigenvector is in the image by taking the dot product of the eigenvector and the difference of the image and the average image.
Reconstructing the Video
I did this for each image and then reconstructed the image as a sum of the average image plus the eigenvectors (resulting in an image similar to the original).
I combined these reconstructed images to get this video:
The reconstructed video(2.8 MB)
Estimating the Video
Then, I fit a function (a function of the day and the time of day) to each eigenvector's coefficient and used that to construct this video (what you would expect to happen during the fall):
The estimated video(0.4 MB)
Correcting Brighness
I characterized the brightness of the pictures by taking the intensity of pixel (164,207):
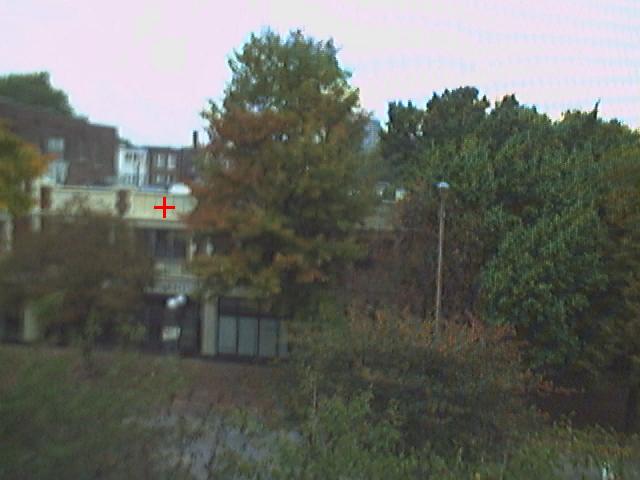
The idea was that I could use this pixel as an indicator of how bright the day was.
I used linear regression on the images to determine what component of the pictures changed with this pixel.
That component looked like this:
So, you can see that on bright days, the sky is bluer and the foreground is lighter.
Then, I subtracted as much of this component as was necessary from each image so that all the images would be about the same brightness.
The result was a video where that one pixel has a constant intensity value and some, but not all, of the flickering is removed:
The brightness-subtracted video(3.3 MB)
This was a moderate success, but I think I could improve on it by doing a similar thing with the sky.
Unfortunately, I can't do any such thing with the trees, as that's where the important information is; you need to see the trees' colors changing, and correcting the trees' brightness would hamper this.
Conclusion
I'm afraid you must draw your own conclusions.
There were some fairly standard results (the eigenvectors), some interesting video (the estimated video), and the brightness removal (perhaps a novel approach).